Project journal · Winsted, Connecticut · September 2026
Building Winsted twice: first as a map, then as a town.
It began with a charming open-source miniature-map experiment. It turned into a five-kilometre WebGL town, a mobile streaming problem, an address index, a LiDAR discovery, and a local AI texturing lab.
This is the whole trail—the useful decisions, the incorrect turns, and the models themselves. The public map is real. The newer LiDAR and generated textures remain experiments until they are aligned, visually reviewed, and deliberately integrated.
The build trail
Nine stages, with the evidence left in.
The project did not move in a straight line. Each stage answered one question and exposed the next one.
-
00
The spark
A tiny-town repository made the idea feel possible.
The reference was TinyTown: open terrain, streets, building footprints, and hand-touched landmarks assembled into an explorable miniature. The attractive part was not “make a map.” It was the possibility of recognizing a place because its ordinary buildings felt specific.
“Can you use this and develop a 3D map of Winsted, Connecticut?”
The first definition of done was deliberately small: make Winsted load, make it navigable, and make ABC Pizza and Dairy Queen recognizable enough to prove the local-landmark idea.
-
01
Open-data foundation
The town arrived as geometry before it arrived as character.
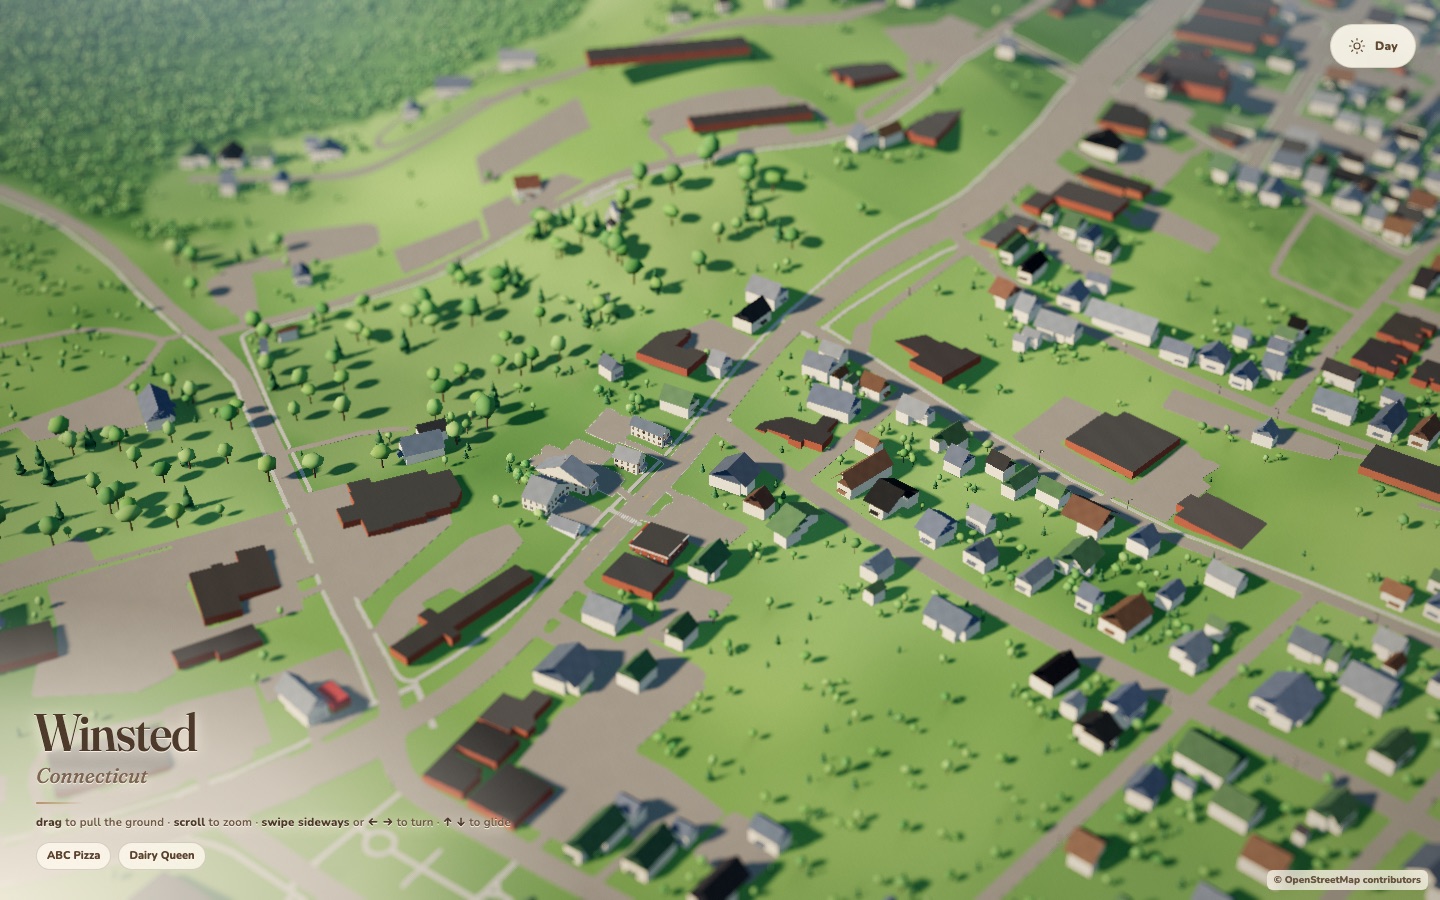
OpenStreetMap supplied roads and building footprints. Open elevation data shaped a roughly five-kilometre landscape around Winsted. The initial scene contained 3,553 buildings—enough to establish the town’s density and street pattern, but mostly as simple extrusions.
That first pass answered the large-scale question: Winsted could exist as one continuous Three.js scene. It also made the fidelity problem obvious. A correct footprint with a generic roof is geographically useful, but it is not yet the building somebody remembers.
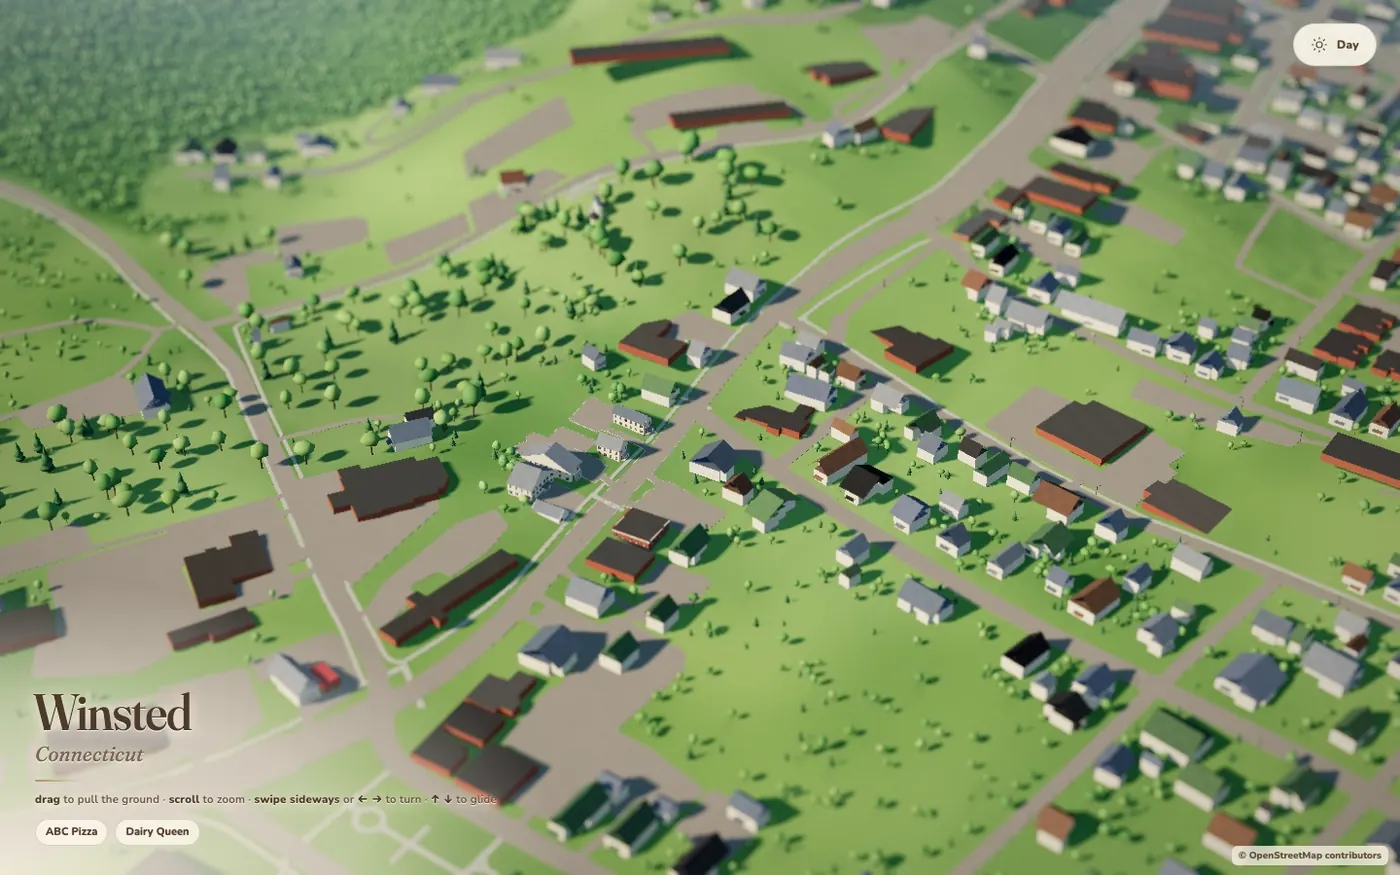
Early complete-town passThe roads, terrain, trees, and thousands of footprint-based buildings were present before the later address, streaming, and LiDAR layers. DecisionKeep the procedural town as the complete coverage layer. Spend handcrafted detail only where recognition has the highest return.
-
02
Local anchors
ABC Pizza and Dairy Queen became the first test of “that’s our town.”
ABC Pizza and Dairy Queen were not selected because they are architecturally grand. They were selected because they are staples. Their silhouettes, roofs, storefront proportions, and signs carry more local recognition than another generic block.
The models were authored as lightweight web geometry so they could sit inside the complete town without turning two landmarks into a performance tax. That tradeoff—specific enough to recognize, simple enough to stream—became the project’s central design rule.
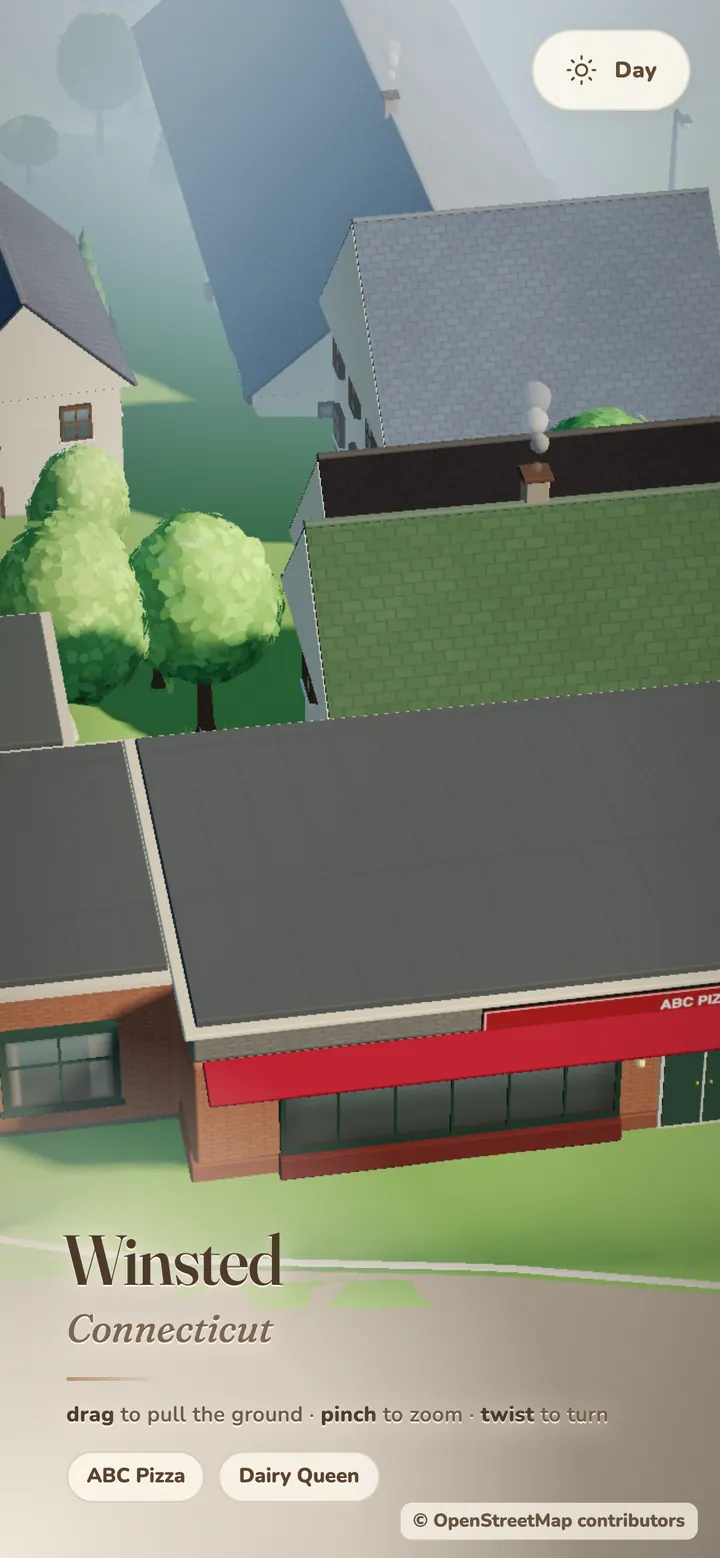
ABC Pizza prototypeHand-built storefront proportions and a recognizable red awning inside the procedural town. 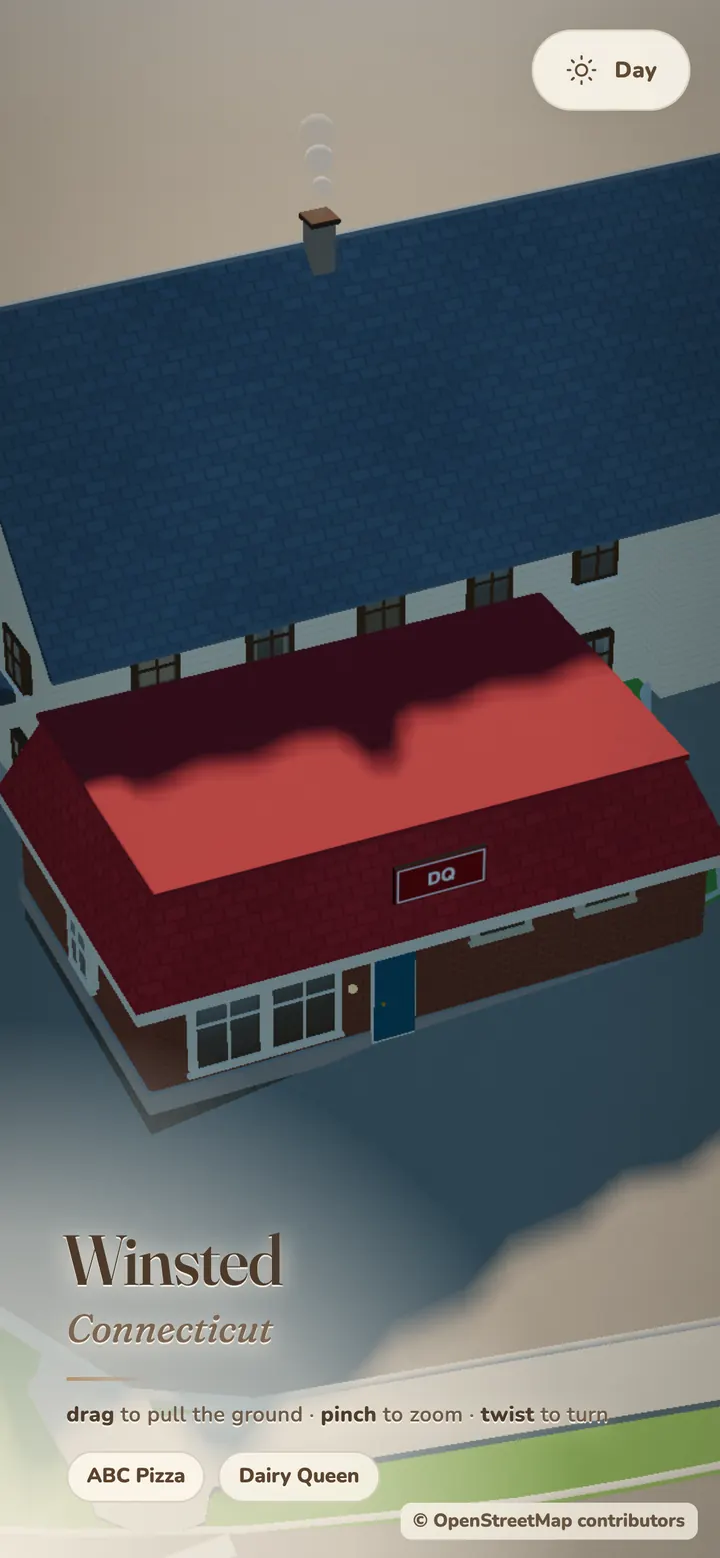
Dairy Queen prototypeA deliberately lightweight local landmark—recognition mattered more than polygon count. The actual published map
Load it here to orbit, or open it full-screen. The preview stays still until requested to protect mobile memory.
Open Winsted in Miniature -
03
The phone said no
The desktop scene worked. Mobile exposed the real delivery problem.
The first public build tried to load too much town at once. On a phone, the experience could stall or fall back into expensive local generation. The fix was architectural rather than cosmetic: bake a small base, divide the town into tiles, then request detail near the camera.
The production manifest now describes 2,231 tiles, 168 regions, and 225 detailed tile assets. Winsted defaults to this streamed path. The public experience looks like one town, but it arrives as a sequence of bounded decisions.
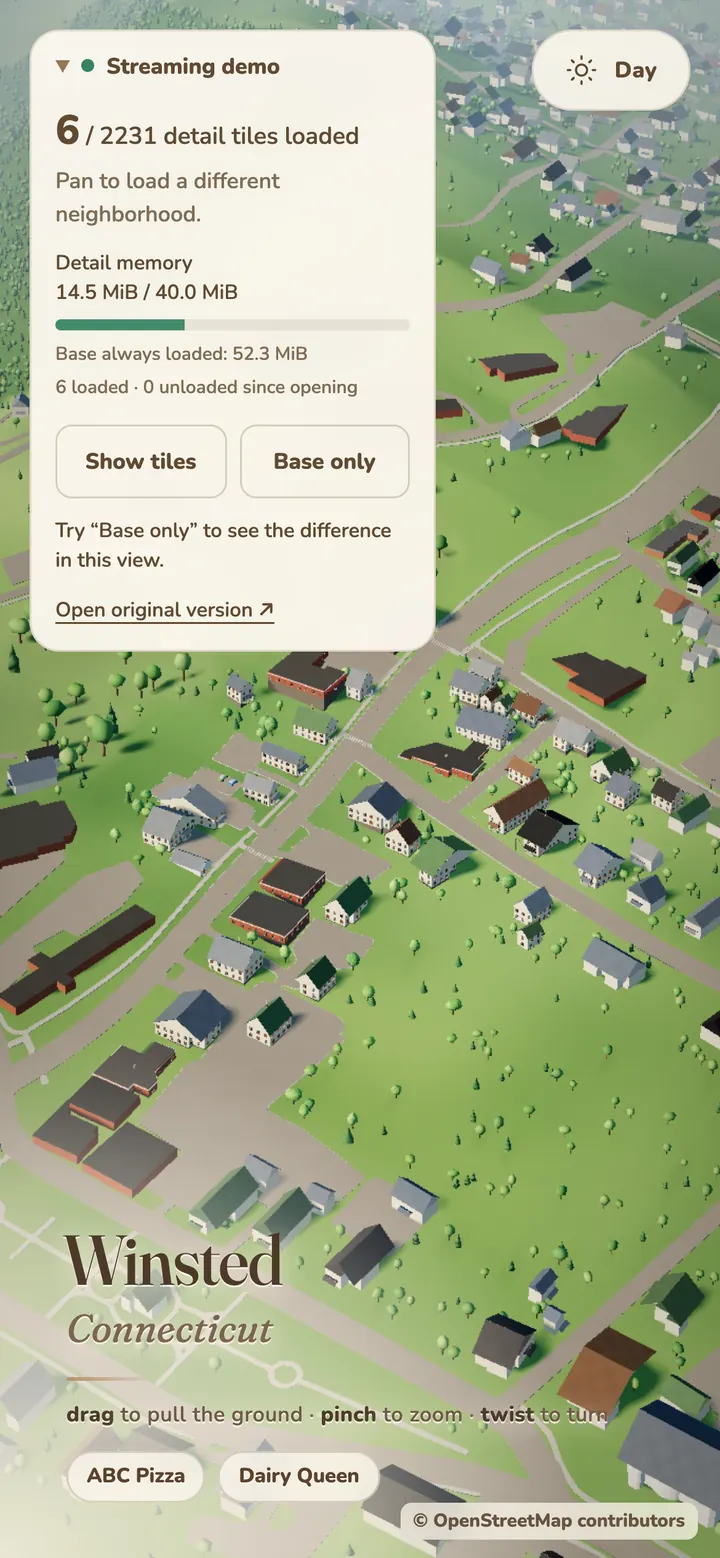
Instrumented buildThe temporary diagnostic panel made tile count and memory use visible while the streaming rules were tuned. 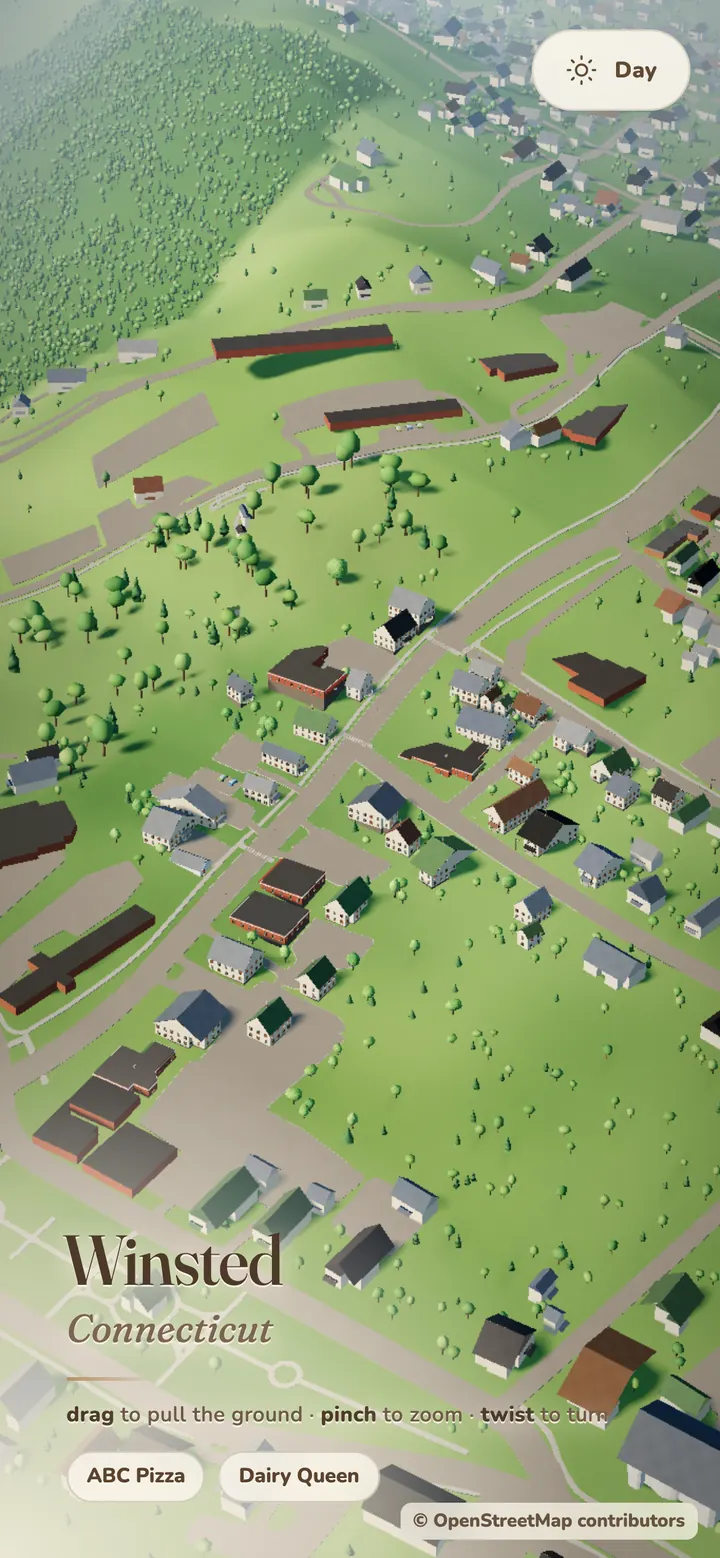
Visitor viewThe same streamed town after the diagnostic layer moved out of the way. 4.58 MBcompressed streaming base during QA40 MiBmobile detail budget6maximum active detail tiles on mobileLessonMobile was not the smaller version of the desktop implementation. It forced the scene to become a real delivery system.
-
04
Finding a place
A model of a whole town still needs the most ordinary map feature: “take me there.”
The address layer came from Connecticut’s public address-point dataset. It is kept separate from the 3D building geometry, then projected into the same local coordinate system at runtime. Search accepts street fragments and familiar place names, groups repeated source points, and calculates a camera view that fits the destination on desktop or mobile.
The shipped index contains 3,465 public address points. The UI turns those into a smaller set of searchable destinations without placing labels over every roof. That distinction matters: the address data overlays the experience, but it does not have to clutter the scene.
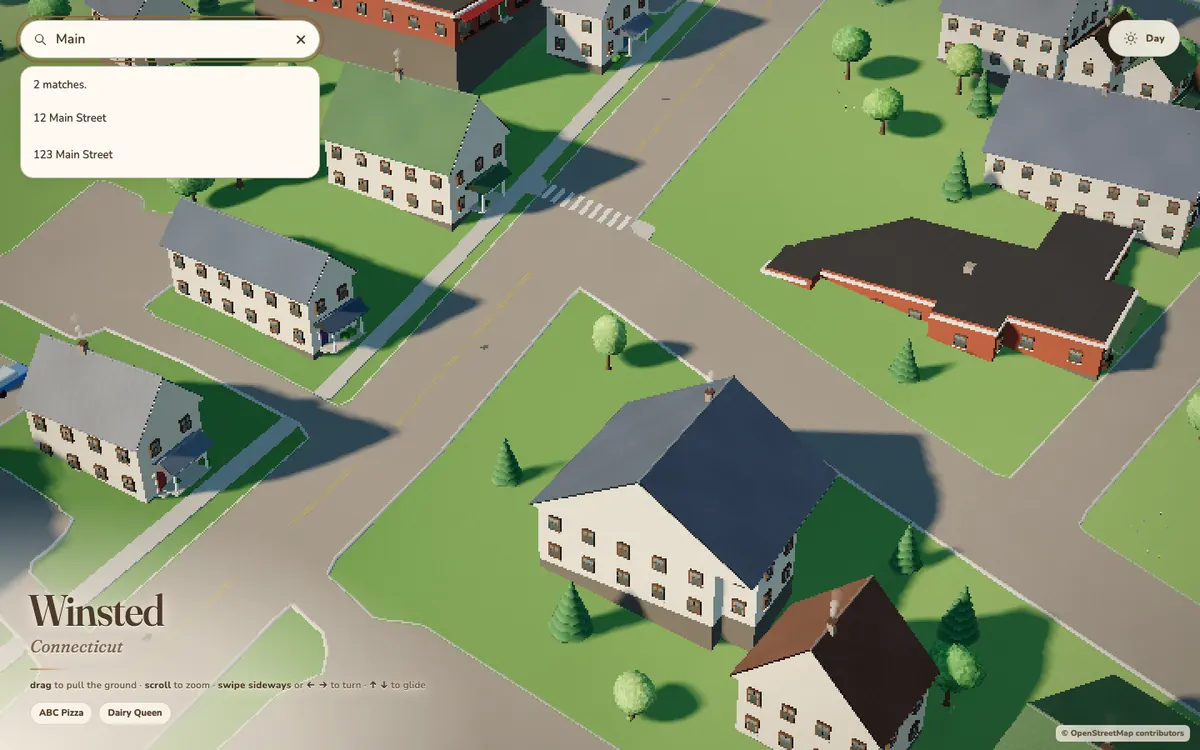
Desktop searchResults sit above the scene and disappear when they are no longer needed. 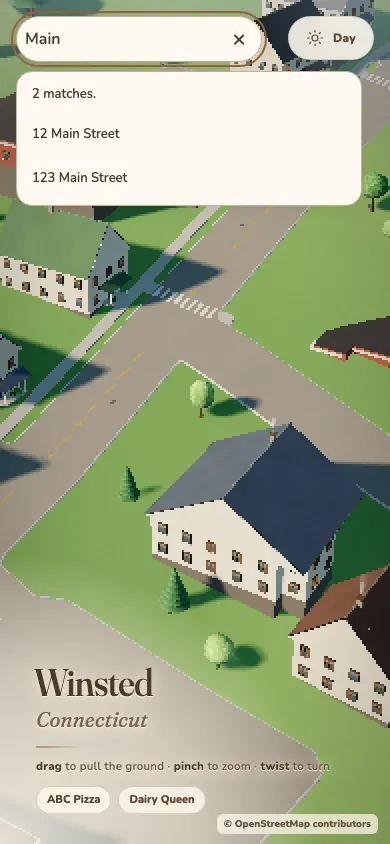
Mobile searchThe same index, camera fit, and result grouping on a phone. DecisionUse addresses as navigation data, not decoration. Show the result when somebody asks for it; keep the town readable the rest of the time.
-
05
The LiDAR turn
Then we found the state’s actual 3D building shells.
Connecticut’s 2023 LiDAR-derived building dataset changed the fidelity ceiling. These were not footprints extruded to a guessed height. They carried rooflines, connected masses, and measured vertical form. A bounded pilot extracted 34 source buildings around nine landmark areas.
The gain is visible immediately: roof steps, annexes, and awkward real-world massing appear without hand-modeling each face. The limitation is equally important. These are geometric shells, not finished game assets. They do not contain storefront photographs, clean materials, or a solved terrain datum.
Interactive evidence
Nine landmark areas · 34 LiDAR shells
Drag to orbit · scroll to zoom
Model waits until it enters the viewport.
Combined pilot geometry. Vertical placement is rebased for inspection; it is not proof of final terrain alignment.
-
06
Three-building trial
ABC, DQ, and The Gilbert School became the first asset pipeline.
Three landmarks were isolated as portable GLB files. ABC Pizza became the compact commercial test. Dairy Queen preserved two separately identified adjoining source pieces because their ownership relationship was still ambiguous. The Gilbert School tested a larger, more complex footprint; its selected state shell overlaps the current main OpenStreetMap school footprint by 93.58 percent.
Waiting to load.
ABC Pizza143 triangles · 35.96 × 18.56 m footprint span Waiting to load.
Dairy Queen111 triangles · two source pieces retained Waiting to load.
The Gilbert School577 triangles · 1,731 vertices The geometry is lightweight enough for the web and traceable back to official Connecticut source IDs. Centering each asset helps inspection; it does not rewrite the source geography.
-
07
Local AI texture lab
Meshy looked convenient. The local open-source route taught us more.
A Meshy upload package was prepared, but no paid job was submitted. Reference-photo licensing was a real constraint, and the free workflow did not offer the control this experiment needed. The alternative became Blender 5.2, the StableGen add-on, ComfyUI, RealVisXL, and a depth ControlNet—running locally on the Mac.
The first prompt failed in a useful way. It asked for a “material texture” and a burgundy awning. The model read the shallow building silhouette as two enormous awnings attached to a brick wall. The second pass reframed the subject as an entire detached low-rise building. The third gave the overhead camera its own roof-only instruction.
Same shell · same camera · three stages
Measured → misunderstood → corrected
Orbit any panel. All three views move together so roof, wall, and footprint changes stay aligned.
Waiting to load.
Before · measured shellLiDAR geometry only. No façade appearance has been invented yet. Waiting to load.
Iteration 1 · semantic failureThe shell survived; the image model misunderstood the subject’s scale. Waiting to load.
After · roof-specific passFull-building semantics improved. Appearance is still generated, not an observed façade. 5orthographic views24steps in the corrected pass143 / 143world-space triangles preservedLessonAI could invent plausible surface detail quickly. It could not establish what the building actually looks like. Geometry preservation passed; façade accuracy still requires licensed photographs and human review.
-
08
Where this goes next
The realistic city is a hybrid, not one magic model.
The best path combines systems instead of asking one of them to do everything. OpenStreetMap keeps complete coverage. LiDAR supplies measured massing and roof shape. Address points make the town searchable. Licensed street-level photographs provide observed colors, windows, doors, signs, and material breaks. Blender handles alignment, cleanup, UVs, façade masks, and deliberate exceptions. Generated texture tools can fill low-risk gaps, but every landmark needs a truth check.
The public miniature is already useful. The research pipeline is about earning the next level of realism without losing performance, provenance, or the completeness that made the first map work.
Sources & boundaries
What is measured, generated, and still unresolved.
Map and addresses OpenStreetMap contributors; Connecticut public address points, dataset m6xx-nb28, public domain.
Building geometry Connecticut State GIS Office, 2023 LiDAR-derived buildings, CC0. The pilot uses selected building IDs, not an unreviewed citywide replacement.
Texture software Blender, StableGen, and ComfyUI are open-source. RealVisXL and the depth ControlNet retain their own model licenses.
Accuracy boundary Generated windows, doors, signs, colors, and materials are hypotheses. No Google Street View image was bundled, uploaded, or republished in this experiment.